November 18, 2024
 4 min reading


In our role as staff here in Minitab (collectively grateful for this incredible opportunity!), we were challenged to solve a problem: “How can we leverage our analysis skills to help our marketing team increase participation in events, webinars, etc.?”
How predictive analysis can help improve participation in events and webinars
The challenge: increase the participation of registered participants
The Minitab team does the best work in creating webinars and events on diverse and immersive topics that have significant interest. In comparison with the sector patternsMinitab does an excellent job of converting registrants to webinars and regularly reaching a large audience at events. As part of our commitment to continuous improvement, we are tasked with helping the marketing team achieve improvement.
Brainstorm two factors that increase participation
Under different circumstances, the most critical factors for participation are content, palestrantes and custos. as or Minitab Exchanges is free (and will happen in a city right for you!), besides the variety of contents and palestrantes, we use a mind map do Minitab Workspace To carry out a brainstorm two hairs reasons that all of you registered were appearing.
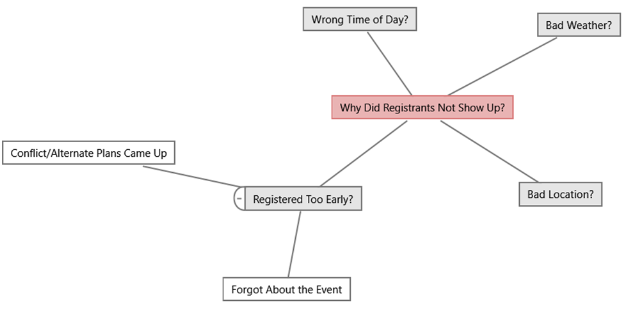
As the time is clearly out of the control of the event organizer at the time of day and local forums presented at the time of registration, we decided to delve deeper to understand the moment in which someone is expected for an event affecting the probability of people participating in the event. Also, we want to know how these discoveries can be used to guarantee greater success and participation in future events.
Using predictive analytics for immediate insights
To answer that question, we employ or CART®, which is a simple and intuitive predictive analysis tool included not Minitab Statistical Software, which provides an explainable solution in the form of a decision tree diagram.
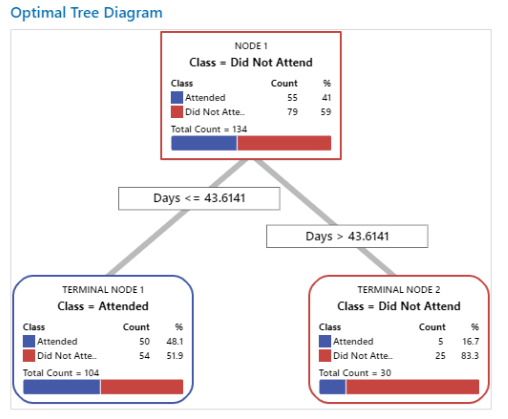
First, we prepare the data by creating a variable called “days” that numerically quantify the duration between the registration data of the event. Next, we combine the data from various locations and let's find out what the CART® is and what we discover.
Analyze taking action plans
Among the 134 registered, we will increase more than 44 days (about 1 month and a half) before the event, with a frequency rate of 16.7%. In comparison to those that were increased less than 44 days before, we see that there is a participation tax much higher than 48.1%. The analysis illustrates that the moment a participant becomes suspicious affects his or her probability of participating in the event. So, how can our discoveries be used to improve participation taxes?
We wanted to find a tangivel and practical solution for this frequency problem (which does not just prohibit registration with more than 43.6 days in advance!). How can we effectively increase this participation tax of 16.7%?
Our solution for the problem
For better entertainment, we suggest that marketing communicate more with participants who will be informed more than a month and a half before the event. This can be done by means of a greater frequency of links, texts, e-mails or even by means of a raffle held on the day of the event to further solidify participation.
We believe that these conclusions can be applied universally to those who want to guarantee greater participation in events of any size. Thanks to the predictive analysis tools, Minitab Statistical Software, we managed to create a concrete solution based on data for that problem!
Source: Minitab
Talk to me Software.com.br and know better Minitab together with a specialist.